








A clear breakdown of what Brainforge fixes, how fast, and what it actually delivers.
An agent that answers a question is a single LLM call. An agent that researches, calls tools, drafts, and revises is a system, and systems fail in ways that no single prompt explains. At Brainforge we build those systems for clients and we run them in our own platform: Mastra agents that summarize meetings and draft case studies, chat routes, voice interview traces, and Cloudflare workers that move data. Every one of them reports into Langfuse, and when Langfuse rewrote its platform as v4, we migrated early and rebuilt our observability habits around what the new model makes possible.
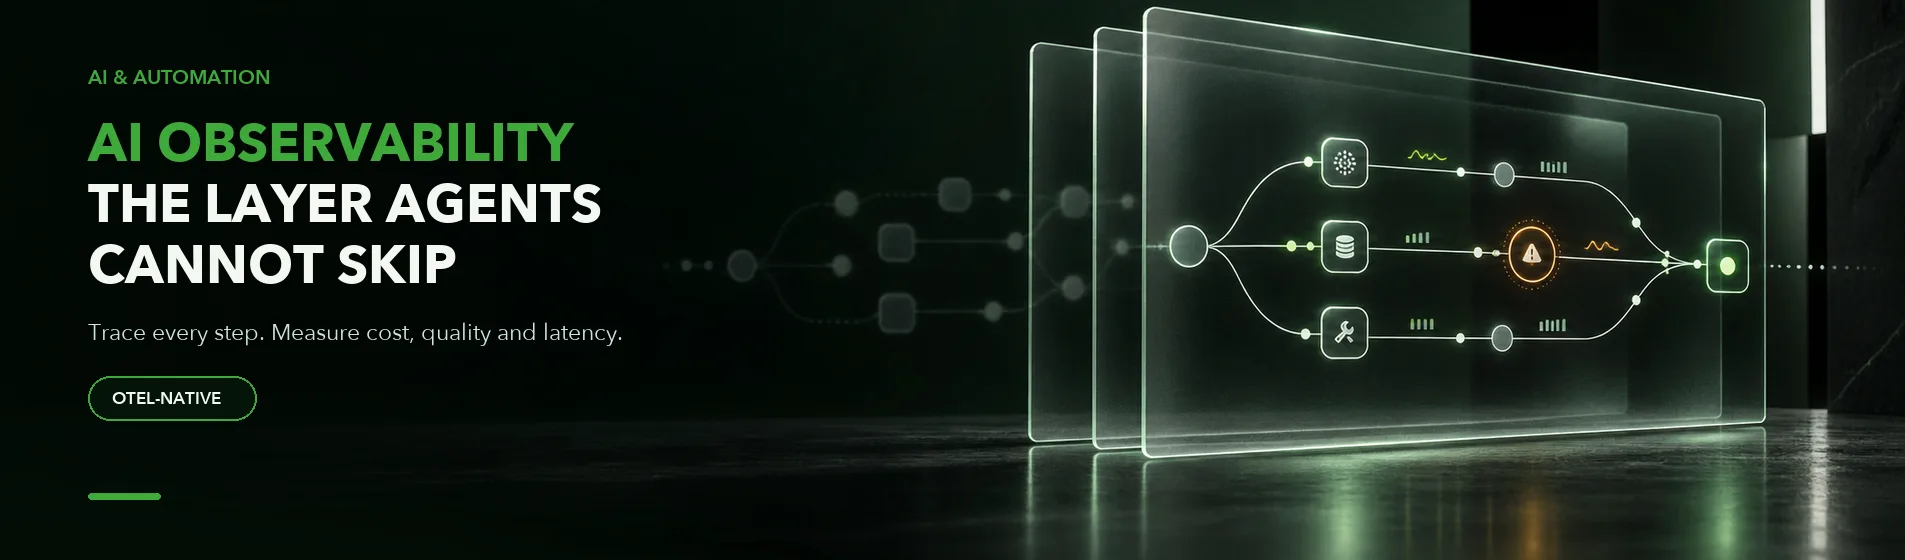
This post is about why observability is the layer you cannot skip, and what the OTEL-native rewrite of Langfuse v4 unlocked for us in practice.
Key Takeaways
- Agents are nondeterministic. The same prompt and tools produce different traces run to run, so you need to observe behavior, not assume it.
- Langfuse v4 is built on OpenTelemetry. One denormalized, append-only observations table means queries scan less data, and the SDK now shares context with the rest of your OTEL instrumentation.
- Search, monitoring, and evaluation finally feel first-class. Full-text search across inputs and outputs, monitors that alert to Slack, and code evaluators that run deterministic checks on live observations.
- Observability pays for itself in cost and quality. Once every agent step is a queryable row, you stop guessing which model or surface is burning your budget.
Why agents break the old mental model
Traditional software is deterministic enough to debug from logs and stack traces. An agent is a loop over an LLM with tools in the middle, and the interesting failures live in the middle: a tool returned something the model misread, a step budget ran out mid-task, a retrieval call pulled the wrong context, a streaming response closed the span before the agent finished. None of those show up as exceptions. They show up as traces that look subtly wrong, if you can see them at all.
We learned this the direct way. Our early instrumentation produced traces where the parent showed the user's input but an empty output, while the child generation underneath held the real answer. The agent had finished, but the root span had closed first and the update was silently dropped. You only catch a bug like that when the shape of the trace is visible. Without observability, it would have shipped on every streamed reply and stayed invisible.
What changed in v4
Langfuse v4 is a data model change as much as a feature release. Older versions stored mutable traces and observations in separate tables, and every query had to join them and deduplicate updates. That was slow at scale. v4 writes each observation once to an append-only table, so a query needs neither a join nor a dedup pass. Langfuse reports initial table loads dropping from seconds to milliseconds and dashboards loading at least ten times faster on large projects.
The SDK followed the same logic. The TypeScript SDK is now a thin layer on the official OpenTelemetry client that turns emitted spans into Langfuse observations and adds helpers for token usage, cost, and prompt linking. Because it lives in the shared OTEL context, spans from other OpenTelemetry-instrumented libraries export to Langfuse too. For us that meant one mental model: instrument once with OTEL, and the trace is available wherever your observability backend expects it.
What it unlocked for us
Every agent step became queryable
The shift from "trace me a generation" to "give me every observation" matters more than it sounds. We can now ask which tool call in which surface is slow, which model a given route used, and how many tokens a single turn consumed, because tool executions, agent steps, and generations are all first-class rows. Our agents tag their traces, so filtering by product surface or release is routine.
Cost stopped being a surprise
Before we could see cost per model and per surface, budget conversations were arguments. Now they are queries. We can tell which experiment burned tokens, which product surface is expensive to run, and what a prompt version change did to spend, because cost lands on the observation at ingest time rather than being reconstructed later.
Evaluation became part of the build
Langfuse v4 adds code evaluators that run deterministic Python or TypeScript checks on live observations, monitors that alert through Slack, webhooks, or GitHub Actions when cost, quality, or latency cross a threshold, and a v2 metrics API that aggregates cost, tokens, volume, latency, and scores. We use traces as the assertion layer in tests, and our internal agent tooling scores runs against thresholds. When an agent run goes sideways, the score and the trace are the same object, so the discussion starts from evidence.
Observability surfaced waste we did not know we had
The most valuable output was not a dashboard. It was a number we had not measured: across a whole population of our own agent runs, every single trace exceeded eighty percent of its context window. We had been building agents that quietly ran near the edge of their context every time. That is the kind of finding that only exists once full-text search and observation-level analytics are cheap enough to run at that scale.
Signs your team needs this layer
- You cannot answer what a given agent run cost last week, because the data is not queryable.
- You debug agent behavior by re-running it and hoping it reproduces.
- You are adding tools or retrievers faster than you can watch them.
- Your "eval" is a handful of prompts checked by eye.
- You are about to ship agents to users and have no alert when quality or latency degrades.
If any of those feel familiar, the fix is not more careful prompting. It is a trace on every step, a score on every run, and the discipline to read them.
We build and run AI observability systems for teams that want this layer without building it from scratch. Book a call and we will map what your agents are actually doing, and costing, today.