Marketing

Finally, One View of Every Marketing Campaign

How Brainforge unified fragmented advertising data into one campaign measurement system, reducing reporting cycles 70% and improving spend efficiency by 35%.

Start with a 2-week sprint
START WITH A
2-Week Sprint

In one call, we'll clarify what's broken, what's possible, and what it'll take to fix it with zero pressure to commit.

upper line backgroundspiral, green lines

At a glance

Client

Multi-Channel Advertising Provider

Function

Marketing Analytics

Project Type

Advertising Measurement System

Project Duration

1 Month

Context

Advertising performance lost in fragmented data and manual processes

The client's ad performance data was scattered across multiple digital and traditional channels, forcing manual consolidation that slowed reporting and obscured full-funnel visibility. Inconsistent metrics between marketing, finance, and ad-buying teams created bottlenecks, misalignment, and delayed GTM decisions.

Fragmented ad data

Disparate digital and traditional data blocked a unified performance view

Manual, inefficient reporting

Time-consuming consolidation limited visibility into creative and full-funnel results

Misaligned GTM metrics

Inconsistent reporting across teams slowed decisions and created operational friction

Challenge

Lack of centralized advertising intelligence stalled growth

This meant wasted ad spend, delayed budget shifts, and missed opportunities to test and scale winning creative.

With no single view of performance, the client's data was scattered across digital and traditional media, budgets were allocated without unified KPIs, and reporting was slow enough to delay decisions. They could not scale GTM workflows or act on media insights quickly.

Solution

Unified advertising performance system for real-time GTM decisions

Brainforge deployed an embedded advertising performance system that unified cross-platform data through ETL pipelines built with Fivetran, creating a single source of truth for results. Custom BI dashboards delivered daily, weekly, and monthly insights at creative, campaign, and channel levels, while AI copilots proactively flagged underperforming assets and budget misallocations.

The solution integrated seamlessly into GTM workflows, enabling ad buyers, marketing leaders, and finance teams to act on aligned, real-time insights.

Results

Measurable gains in advertising accuracy and efficiency

Ad ROI tracking precision improved across all media, reporting consolidation took a fraction of the time per campaign cycle, and smarter budget reallocations lifted spend efficiency.

Impact

Lasting impact on GTM agility and advertising strategy

The dashboards and AI copilots shifted marketing from reactive analysis to proactive campaign steering. Teams optimized creatives and budgets in real time. Marketing, finance, and product now share the same metrics, so GTM decisions move faster. The architecture also gives the client a template for measuring new channels as they come online, so experimentation is faster and media spend decisions are smarter.

Real-time GTM decisions

Marketing teams shifted from reactive analysis to proactive campaign steering

Cross-functional alignment

Marketing, finance, and product now operate off shared metrics, accelerating GTM cadence

Replication ready

The integrated architecture serves as a replicable model for all future channels

Tools used

The dashboards and AI copilots shifted marketing from reactive analysis to proactive campaign steering. Teams optimized creatives and budgets in real time. Marketing, finance, and product now share the same metrics, so GTM decisions move faster. The architecture also gives the client a template for measuring new channels as they come online, so experimentation is faster and media spend decisions are smarter.

At a glance

Client

Multi-Channel Advertising Provider

Function

Marketing Analytics

Project Type

Advertising Measurement System

Project Duration

1 Month

Context

Advertising performance lost in fragmented data and manual processes

The client's ad performance data was scattered across multiple digital and traditional channels, forcing manual consolidation that slowed reporting and obscured full-funnel visibility. Inconsistent metrics between marketing, finance, and ad-buying teams created bottlenecks, misalignment, and delayed GTM decisions.

Fragmented ad data

Disparate digital and traditional data blocked a unified performance view

Manual, inefficient reporting

Time-consuming consolidation limited visibility into creative and full-funnel results

Misaligned GTM metrics

Inconsistent reporting across teams slowed decisions and created operational friction

Challenge

Lack of centralized advertising intelligence stalled growth

This meant wasted ad spend, delayed budget shifts, and missed opportunities to test and scale winning creative.

With no single view of performance, the client's data was scattered across digital and traditional media, budgets were allocated without unified KPIs, and reporting was slow enough to delay decisions. They could not scale GTM workflows or act on media insights quickly.

Solution

Unified advertising performance system for real-time GTM decisions

Brainforge deployed an embedded advertising performance system that unified cross-platform data through ETL pipelines built with Fivetran, creating a single source of truth for results. Custom BI dashboards delivered daily, weekly, and monthly insights at creative, campaign, and channel levels, while AI copilots proactively flagged underperforming assets and budget misallocations.

The solution integrated seamlessly into GTM workflows, enabling ad buyers, marketing leaders, and finance teams to act on aligned, real-time insights.

Results

Measurable gains in advertising accuracy and efficiency

Ad ROI tracking precision improved across all media, reporting consolidation took a fraction of the time per campaign cycle, and smarter budget reallocations lifted spend efficiency.

Impact

Lasting impact on GTM agility and advertising strategy

The dashboards and AI copilots shifted marketing from reactive analysis to proactive campaign steering. Teams optimized creatives and budgets in real time. Marketing, finance, and product now share the same metrics, so GTM decisions move faster. The architecture also gives the client a template for measuring new channels as they come online, so experimentation is faster and media spend decisions are smarter.

Real-time GTM decisions

Marketing teams shifted from reactive analysis to proactive campaign steering

Cross-functional alignment

Marketing, finance, and product now operate off shared metrics, accelerating GTM cadence

Replication ready

The integrated architecture serves as a replicable model for all future channels

Tools used

The dashboards and AI copilots shifted marketing from reactive analysis to proactive campaign steering. Teams optimized creatives and budgets in real time. Marketing, finance, and product now share the same metrics, so GTM decisions move faster. The architecture also gives the client a template for measuring new channels as they come online, so experimentation is faster and media spend decisions are smarter.

What success actually looks like

Each story started the same: pressure to "do AI," broken tools, and no clear plan. See what changed after we partnered up.

Clean Data for Smarter Sales Ops

Shipping

Clean Data for Smarter Sales Ops

How We Saved a Retailer Thousands

E-Commerce

How We Saved a Retailer Thousands

Finally, One View of Every Campaign

Marketing

Finally, One View of Every Campaign

What changes when you work with us

Portraits of four smiling diverse adults in circular frames against natural and neutral backgrounds.

If you're overwhelmed, misaligned, and under pressure to "do AI", we've got the map out. Here's what transformation feels like.

Before
Everyone's blind in a different way
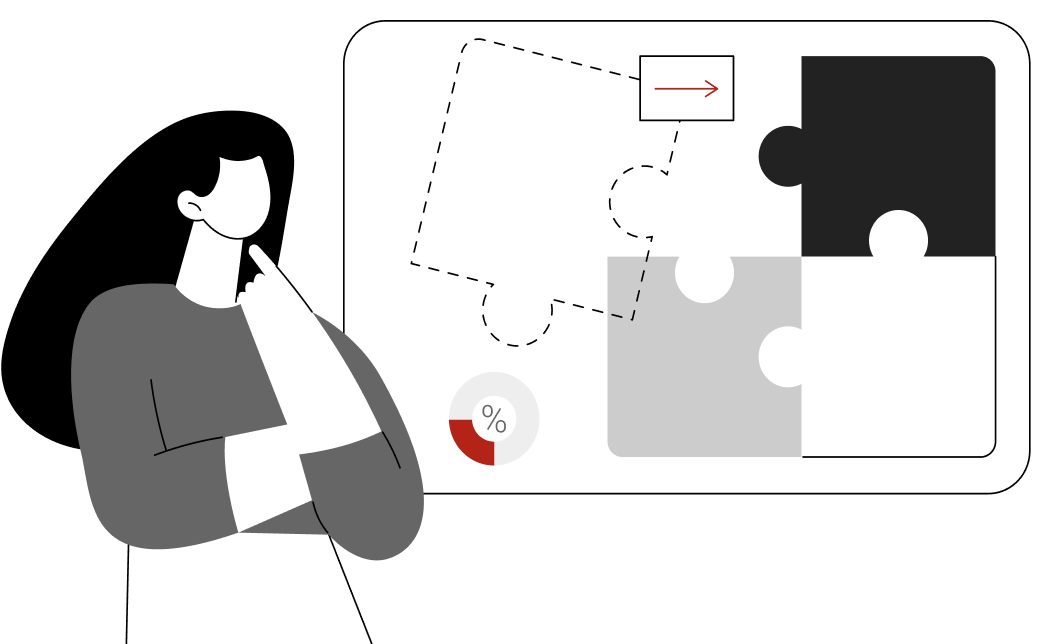
Illustration of a person thinking while looking at a screen with puzzle pieces.
After
One source of truth,
visible to all

See real examples →

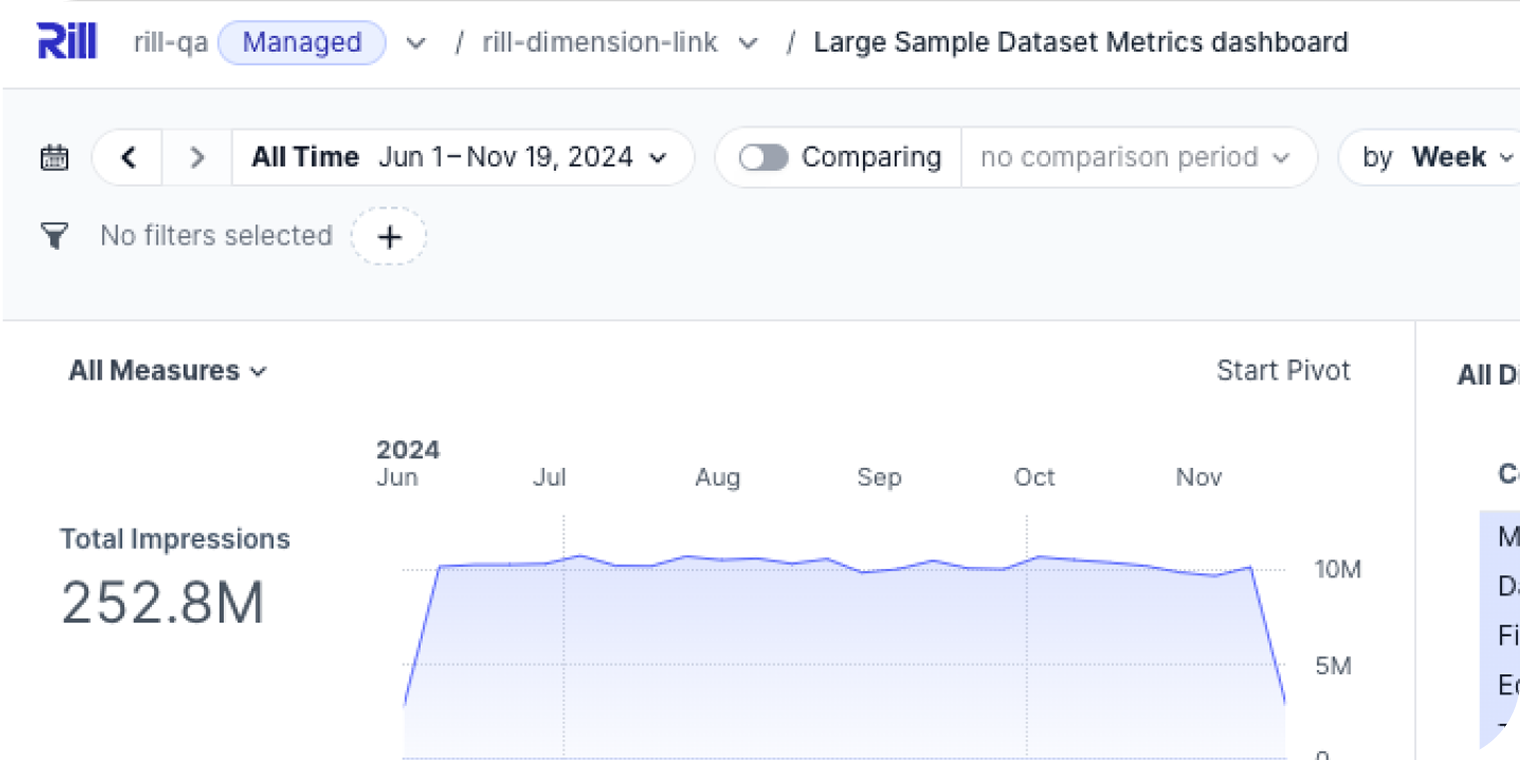
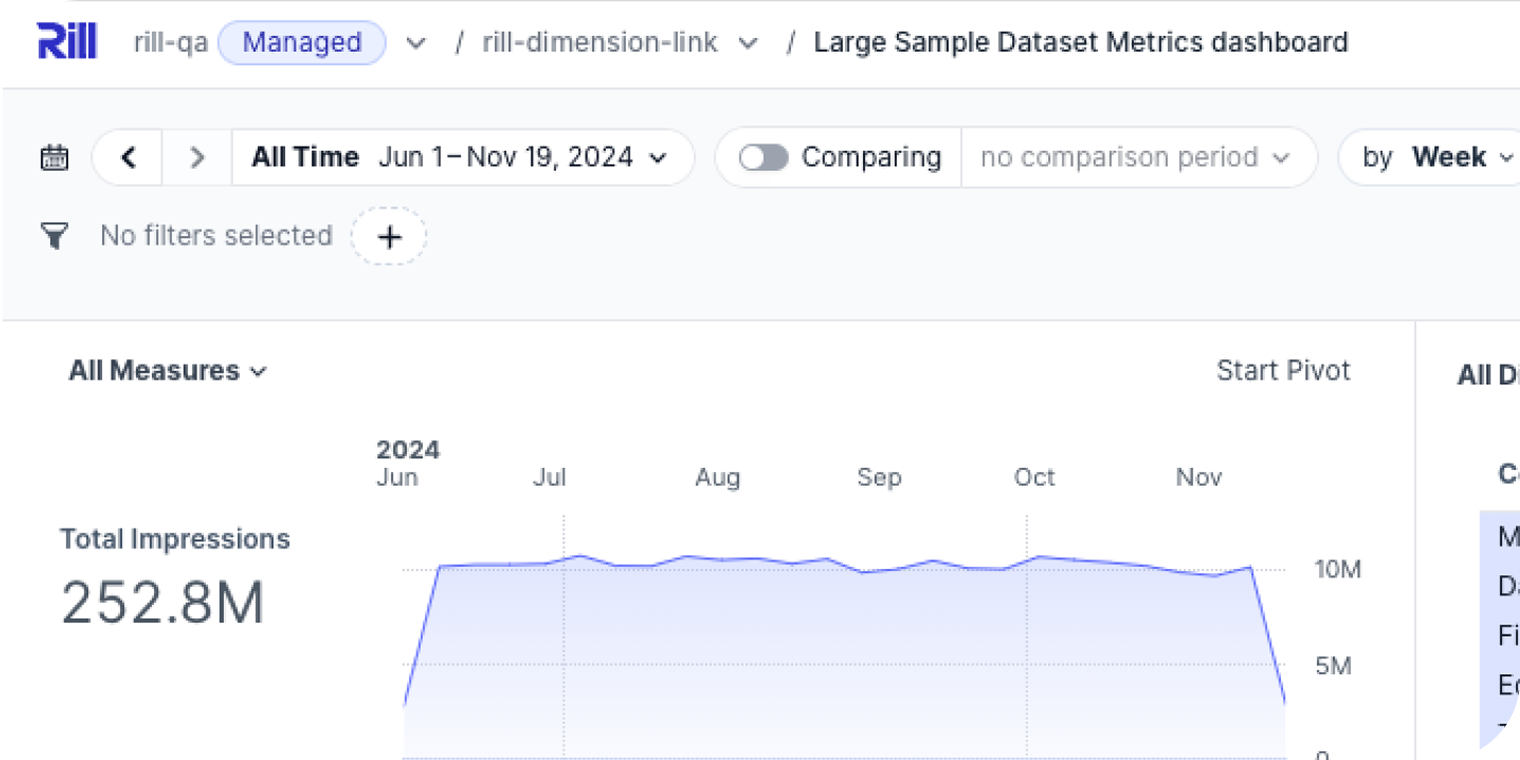
Dashboard graph showing total impressions.
Before
AI lives in the roadmap
Illustration of computer screens with warning symbols and an AI profile icon.

After
AI is in production, saving hours

See real examples →

Illustration of AI technology with data charts and a world map.
Before
Frustration and firefighting
Illustration of a person sitting in front of a laptop with hands on their head surrounded by speech bubbles.
After
Clarity and compounding progress

See real examples →

Illustration of three people collaborating around a circular chart with a trophy icon.
Before
Competing priorities
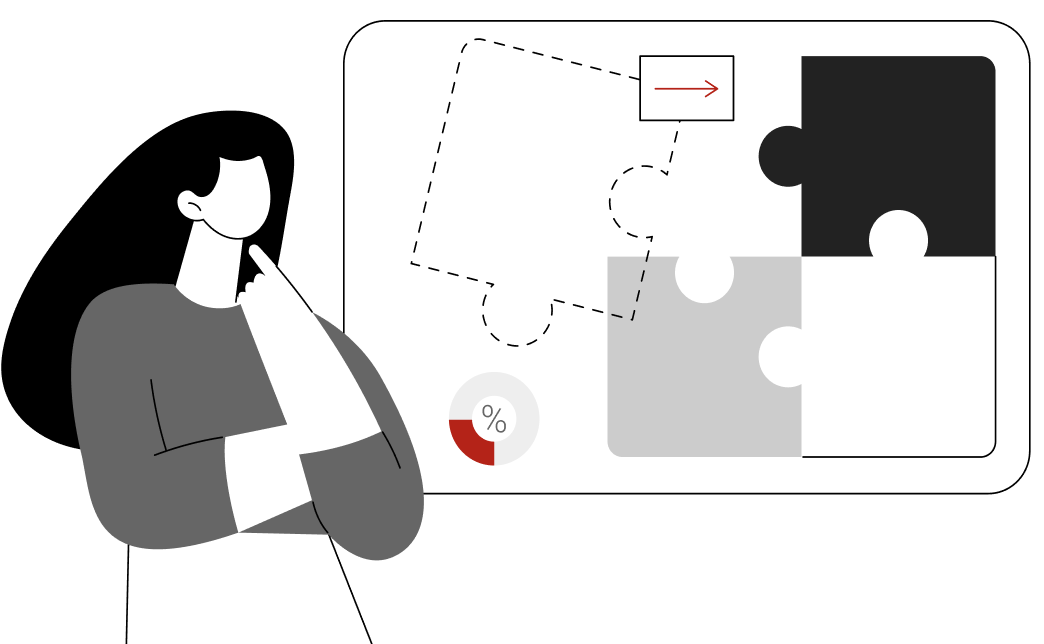
Person thinking in front of a board showing four puzzle pieces.
After
Alignment and real metrics

See real examples →

Person pointing at the bullseye of a target with a dart.
Before
Disjointed tools, no ownership
Illustration of two people reviewing charts and data, with one person holding a tablet.
After
Clean pipelines, owned outcomes

See real examples →

Illustration of a man and a woman working on laptops and discussing software development.

Our Trusted Partners

We only bring the best of the best

Explore partnerships →

One call. One clear next step.

Start with a 2-week sprint.

We’ll clarify what’s broken, what’s possible, and what it will take to fix it, with zero pressure to commit.

Start with a 2-week sprint
AI Readiness Report
A clear breakdown of what Brainforge fixes, how fast, and what it actually delivers.
AI Readiness Report

Get the best insights right at your inbox.

A clear breakdown of what Brainforge fixes, how fast, and what it actually delivers.

No fluff. Just clarity.
Green spiral lines